
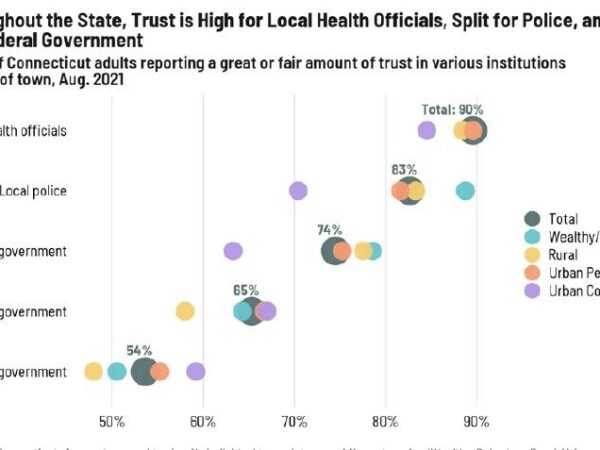
A dot plot shows Connecticut adults trust in local health officials, state government, and federal government by town type. Trust is highest in local health officials, lowest in federal government, across all town types.

2021 DataHaven Community Wellbeing Survey ›

10.06.2021

Statewide survey shows improvements in financial well-being, changes in mask-wearing and vaccination rates, and concerns about gun violence during the pandemic.
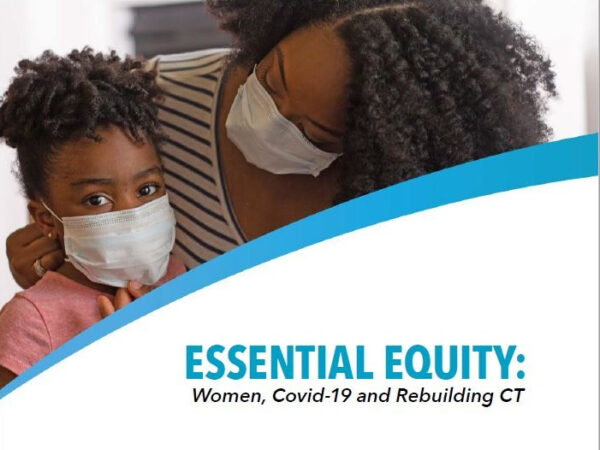
A woman and a young girl, both wearing face masks, embrace and look towards the camera. The text reads: ESSENTIAL EQUITY: Women, Covid-19 and Rebuilding CT against a white background with a blue curved line.

Essential Equity: Women, COVID-19 and Rebuilding CT (2021) ›

02.17.2021

Measuring the unequal impact of COVID-19 and proposals for equitable solutions
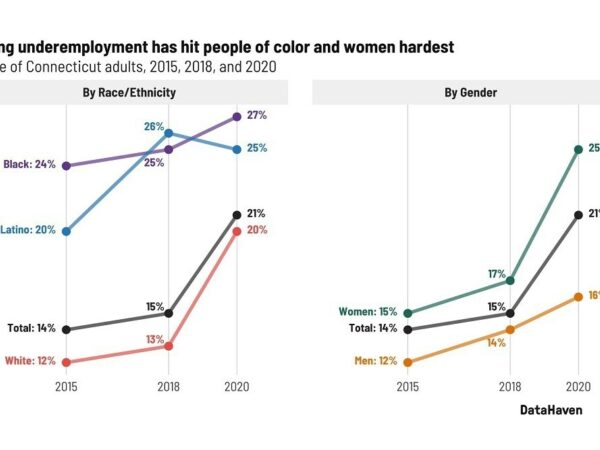
Line graphs showing Connecticut underemployment rates by race/ethnicity and gender for 2015, 2018, and 2020. People of color and women saw the biggest increases, reaching 27% for Black adults and 25% for women in 2020.

Measuring the Impact of COVID-19 ›

09.17.2020

DataHaven Community Wellbeing Survey reveals how daily experiences
differ by age, gender, race and geographic area.

Cover page of a report titled CT Nonprofits & COVID-19: A Pulse Survey on Organizational Impacts and Needs. Logos of four organizations appear at the bottom. The background features a light blue geometric pattern.

CT NONPROFITS & COVID-19: ›

09.04.2020

A Pulse Survey on Organizational Impacts and Needs

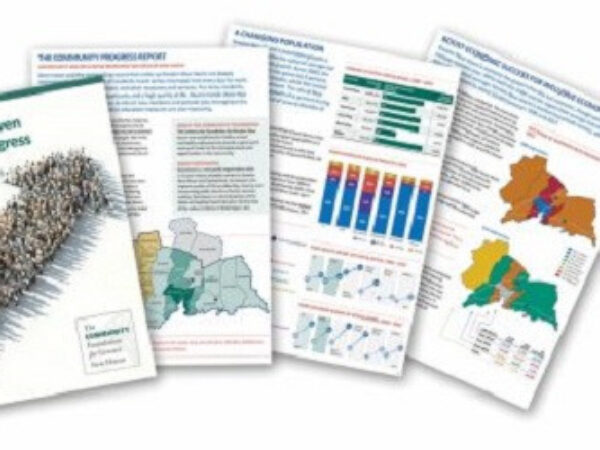
Four pages of the Greater New Haven Community Progress Report 2020, featuring charts, maps, and data visuals, with the cover page showing a crowd of people forming an arrow shape.

Greater New Haven Community Progress Report 2020 ›

04.15.2020

A data report on the health, wellbeing and access to opportunity of different populations in Greater New Haven.

Page 2 of 4